
Page 49 - KMD 2022-23 EDITION
P. 49
Health Sector Statistics
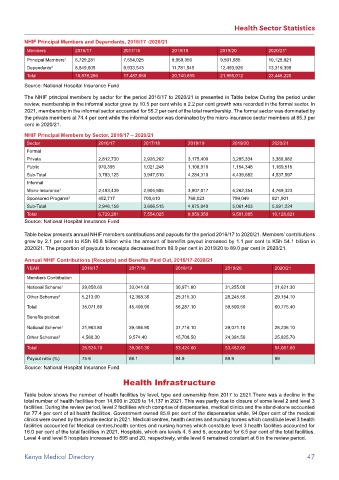
NHIF Principal Members and Dependents, 2016/17 -2020/21
Members 2016/17 2017/18 2018/19 2019/20 2020/21*
Principal Members¹ 6,729,281 7,554,025 8,959,350 9,501,085 10,128,821
Dependents² 8,849,005 9,933,543 11,781,545 12,493,926 13,319,399
Total 15,578,286 17,487,568 20,740,895 21,995,012 23,448,220
Source: National Hospital Insurance Fund
The NHIF principal members by sector for the period 2016/17 to 2020/21 is presented in Table below During the period under
review, membership in the informal sector grew by 10.5 per cent while a 2.2 per cent growth was recorded in the formal sector. In
2021, membership in the informal sector accounted for 55.2 per cent of the total membership. The formal sector was dominated by
the private members at 74.4 per cent while the informal sector was dominated by the micro-insurance sector members at 85.3 per
cent in 2020/21.
NHIF Principal Members by Sector, 2016/17 – 2020/21
Sector 2016/17 2017/18 2018/19 2019/20 2020/21
Formal
Private 2,812,730 2,926,262 3,175,400 3,285,334 3,368,082
Public 970,395 1,021,248 1,108,910 1,154,348 1,169,515
Sub-Total 3,783,125 3,947,510 4,284,310 4,439,682 4,537,597
Informal
Micro-Insurance¹ 2,493,439 2,905,905 3,907,017 4,262,354 4,769,323
Sponsored Progams² 452,717 700,610 768,023 799,049 821,901
Sub-Total 2,946,156 3,606,515 4,675,040 5,061,403 5,591,224
Total 6,729,281 7,554,025 8,959,350 9,501,085 10,128,821
Source: National Hospital Insurance Fund
Table below presents annual NHIF members contributions and payouts for the period 2016/17 to 2020/21. Members’ contributions
grew by 2.1 per cent to KSh 60.8 billion while the amount of benefits payout increased by 1.1 per cent to KSh 54.1 billion in
2020/21. The proportion of payouts to receipts decreased from 89.9 per cent in 2019/20 to 89.0 per cent in 2020/21.
Annual NHIF Contributions (Receipts) and Benefits Paid Out, 2016/17-2020/21
YEAR 2016/17 2017/18 2018/19 2019/20 2020/21
Members Contribution
National Scheme¹ 29,858.60 33,041.60 30,971.80 31,255.00 31,621.30
Other Schemes² 5,213.00 12,368.30 25,315.30 28,245.50 29,154.10
Total 35,071.60 45,409.90 56,287.10 59,500.50 60,775.40
Benefits paidout
National Scheme¹ 21,963.80 29,486.90 37,716.10 29,071.10 28,236.10
Other Schemes² 4,560.30 9,574.40 15,708.50 24,391.50 25,825.70
Total 26,524.10 39,061.30 53,424.60 53,462.60 54,061.80
Payout ratio (%) 75.6 86.1 94.9 89.9 89
Source: National Hospital Insurance Fund
Health Infrastructure
Table below shows the number of health facilities by level, type and ownership from 2017 to 2021.There was a decline in the
total number of health facilities from 14,600 in 2020 to 14,137 in 2021. This was partly due to closure of some level 2 and level 3
facilities. During the review period, level 2 facilities which comprise of dispensaries, medical clinics and the stand-alone accounted
for 77.4 per cent of all health facilities. Government owned 85.8 per cent of the dispensaries while, 94.0per cent of the medical
clinics were owned by the private sector in 2021. Medical centres, health centres and nursing homes which constitute level 3 health
facilities accounted for Medical centres,health centres and nursing homes which constitute level 3 health facilities accounted for
16.0 per cent of the total facilities in 2021. Hospitals, which are levels 4, 5 and 6, accounted for 6.5 per cent of the total facilities.
Level 4 and level 5 hospitals increased to 895 and 20, respectively, while level 6 remained constant at 6 in the review period.
Kenya Medical Directory 47