
Page 54 - KMD 2022-23 EDITION
P. 54
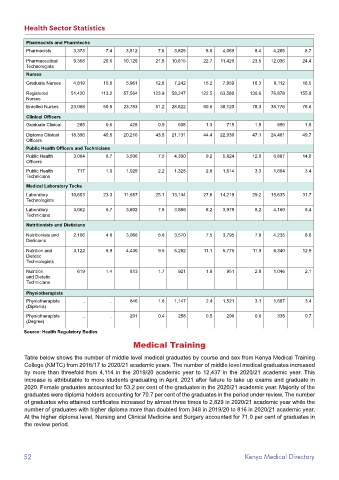
Health Sector Statistics

          Pharmacists and Pharmtechs
          Pharmacists      3,373      7.4    3,512       7.6  3,825      8.0   4,069       8.4   4,285      8.7

          Pharmaceutical   9,358     20.6   10,126      21.8  10,815    22.7  11,429      23.5  12,036     24.4
          Technologists
          Nurses
          Graduate Nurses  4,819     10.6    5,961      12.8  7,242     15.2   7,959      16.3   9,112     18.5
          Registered      51,420     113.2  57,564     123.9  58,247    122.5  63,580    130.6  76,878    155.9
          Nurses
          Enrolled Nurses   23,068   50.8   23,783      51.2  28,822    60.6  38,120      78.3  38,776     78.6
          Clinical Officers
          Graduate Clinical  285      0.6      428       0.9    608      1.3     715       1.5    896       1.8
          Diploma Clinical   18,396  40.5   20,216      43.5  21,131    44.4  22,930      47.1  24,481     49.7
          Officers
          Public Health Officers and Technicians
          Public Health    3,064      6.7    3,506       7.5  4,390      9.2   5,824      12.0   6,887     14.0
          Officers
          Public Health     717       1.6    1,029       2.2  1,328      2.8   1,614       3.3   1,664      3.4
          Technicians
          Medical Laboratory Techs
          Laboratory      10,603     23.3    11,687     25.1  13,144    27.6  14,219      29.2  15,635     31.7
          Technologists
          Laboratory       3,062      6.7    3,602       7.8  3,886      8.2   3,979       8.2   4,160      8.4
          Technicians

          Nutritionists and Dieticians
          Nutritionists and   2,106   4.6    3,066       6.6  3,570      7.5   3,795       7.8   4,235      8.6
          Dieticians
          Nutrition and    3,122      6.9    4,430       9.5  5,282      11.1  5,775      11.9   6,340     12.9
          Dietetic
          Technologists
          Nutrition         619       1.4      813       1.7    921      1.9     951       2.0   1,046      2.1
          and Dietetic
          Technicians

          Physiotherapists
          Physiotherapists    ..        ..     846       1.8  1,147      2.4   1,521       3.1   1,687      3.4
          (Diploma)
          Physiotherapists    ..        ..     201       0.4    258      0.5     296       0.6    335       0.7
          (Degree)
         Source: Health Regulatory Bodies
                                                Medical Training


          Table below shows the number of middle level medical graduates by course and sex from Kenya Medical Training
          College (KMTC) from 2016/17 to 2020/21 academic years. The number of middle level medical graduates increased
          by more than threefold from 4,114 in the 2019/20 academic year to 12,437 in the 2020/21 academic year. This
          increase is attributable to more students graduating in April, 2021 after failure to take up exams and graduate in
          2020. Female graduates accounted for 53.2 per cent of the graduates in the 2020/21 academic year. Majority of the
          graduates were diploma holders accounting for 70.7 per cent of the graduates in the period under review. The number
          of graduates who attained certificates increased by almost three times to 2,829 in 2020/21 academic year while the
          number of graduates with higher diploma more than doubled from 348 in 2019/20 to 816 in 2020/21 academic year.
          At the higher diploma level, Nursing and Clinical Medicine and Surgery accounted for 71.0 per cent of graduates in
          the review period.


         52                                                                            Kenya Medical Directory