
Page 57 - KMD 2022-23 EDITION
P. 57
Health Sector Statistics
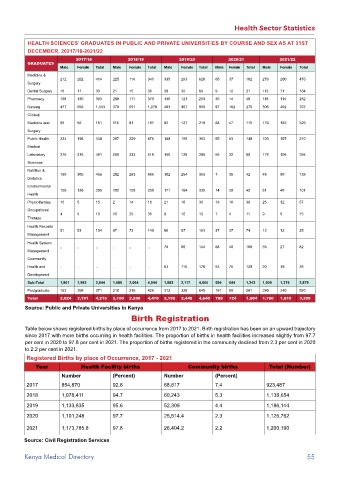
HEALTH SCIENCES’ GRADUATES IN PUBLIC AND PRIVATE UNIVERSITIES By COURSE AND SEx AS AT 31ST
DECEMBER, 20217/18-2021/22
2017/18 2018/19 2019/20 2020/21 2021/22
GRADuATES
Male Female Total Male Female Total Male Female Total Male Female Total Male Female Total
Medicine &
212 202 414 225 116 341 335 293 628 65 37 102 276 200 476
Surgery
Dental Surgery 16 17 33 21 15 36 39 30 69 9 12 21 113 71 184
Pharmacy 168 135 303 208 171 379 136 123 259 35 14 49 118 114 232
Nursing 477 656 1,133 379 691 1,070 403 497 900 97 182 279 305 402 707
Clinical
Medicine and 95 56 151 116 81 197 92 127 219 68 47 115 176 153 329
Surgery
Public Health 234 196 430 267 209 476 188 195 383 65 83 148 103 107 210
Medical
Laboratory 275 216 491 286 233 519 160 128 288 56 32 88 178 106 284
Sciences
Nutrition &
160 305 465 202 283 485 102 254 356 7 35 42 48 90 138
Dietetics
Environmental
159 136 295 192 158 350 171 164 335 14 28 42 61 40 101
Health
Physiotherapy 10 5 15 2 14 16 21 18 39 18 18 36 25 32 57
Occupational
4 6 10 15 20 35 9 10 19 7 4 11 9 6 15
Therapy
Health Records
51 53 104 67 73 140 86 97 183 37 37 74 13 12 25
Management
Health System
.. .. .. .. .. .. 78 66 144 68 40 108 55 27 82
Management
Community
Health and .. .. .. .. .. .. 63 115 178 53 75 128 20 19 39
Development
Sub-Total 1,861 1,983 3,844 1,980 2,064 4,044 1,883 2,117 4,000 599 644 1,243 1,500 1,379 2,879
Postgraduate 163 208 371 210 216 426 312 328 640 181 80 261 280 240 520
Total 2,024 2,191 4,215 2,190 2,280 4,470 2,195 2,445 4,640 780 724 1,504 1,780 1,619 3,399
Source: Public and Private Universities in Kenya
Birth Registration
Table below shows registered births by place of occurrence from 2017 to 2021. Birth registration has been on an upward trajectory
since 2017 with more births occurring in health facilities. The proportion of births in health facilities increased slightly from 97.7
per cent in 2020 to 97.8 per cent in 2021. The proportion of births registered in the community declined from 2.3 per cent in 2020
to 2.2 per cent in 2021.
Registered Births by place of Occurrence, 2017 - 2021
Year Health Facility births Community births Total (Number)
Number (Percent) Number (Percent)
2017 854,870 92.6 68,617 7.4 923,487
2018 1,078,411 94.7 60,243 5.3 1,138,654
2019 1,133,835 95.6 52,309 4.4 1,186,144
2020 1,101,248 97.7 25,514.4 2.3 1,126,762
2021 1,173,785.8 97.8 26,404.2 2.2 1,200,190
Source: Civil Registration Services
Kenya Medical Directory 55