
Page 56 - KMD 2022-23 EDITION
P. 56
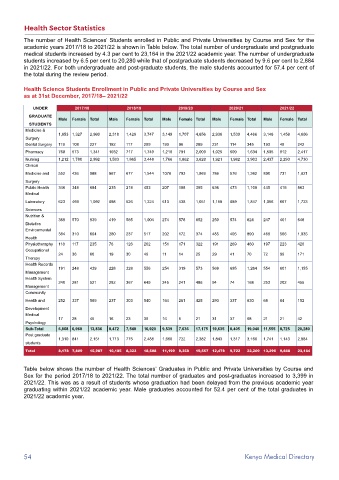
Health Sector Statistics
         The number of Health Sciences’ Students enrolled in Public and Private Universities by Course and Sex for the
         academic years 2017/18 to 2021/22 is shown in Table below. The total number of undergraduate and postgraduate
         medical students increased by 4.3 per cent to 23,164 in the 2021/22 academic year. The number of undergraduate
         students increased by 6.5 per cent to 20,280 while that of postgraduate students decreased by 9.6 per cent to 2,884
         in 2021/22. For both undergraduate and post-graduate students, the male students accounted for 57.4 per cent of
         the total during the review period.


         Health Science Students Enrollment in Public and Private Universities by Course and Sex
         as at 31st December, 2017/18– 2021/22

             UNDER         2017/18            2018/19           2019/20          2020/21           2021/22
           GRADUATE
                      Male  Female  Total  Male  Female  Total  Male  Female Total  Male  Female Total  Male  Female  Total
           STUDENTS
          Medicine &
                      1,653 1,327  2,980  2,318  1,429  3,747  3,149  1,707  4,856  2,936  1,530  4,466  3,148  1,458  4,606
          Surgery
          Dental Surgery  119  108  227  182  117   299   193   96    289   231   114   345   193  49     242
          Pharmacy    768  573   1,341  1032  717   1,749  1,218  791  2,009  1,025  609  1,634  1,505  912  2,417
          Nursing     1,212 1,780  2,992  1,583  1,865  3,448  1,766  1,862  3,628  1,921  1,982  3,903  2,437  2,293  4,730
          Clinical
          Medicine and   552  436  988  867  677    1,544  1076  793  1,869  786  576   1,362  890  731   1,621
          Surgery
          Public Health  346  348  694  235  218    453   207   188   395   636   473   1,109  445  418   863
          Medical
          Laboratory   623  469  1,092  698  526    1,224  613  438   1,051  1,158  689  1,847  1,056  667  1,723
          Sciences
          Nutrition &
                      369  570   939   419   585    1,004  274  578   852   250   574   824   247  401    648
          Dietetics
          Environmental
                      384  310   694   280   237    517   202   172   374   485   405   890   469  566    1,035
          Health
          Physiotheraphy  118  117  235  76  126    202   151   171   322   191   269   460   197  223    420
          Occupational
                      24  36     60    19    30     49    11    14    25    29    41    70    72   99     171
          Therapy
          Health Records
                      191  248   439   228   328    556   254   319   573   569   695   1,264  554  601   1,155
          Management
          Health System
                      240  281   521   282   367    649   245   241   486   94    74    168   253  202    455
          Management
          Community
          Health and   252  337  589   237   303    540   164   261   425   293   337   630   68   84     152
          Development
          Medical
                      17  28     45    16    23     39    16    5     21    31    37    68    21   21     42
          Psychology
          Sub-Total   6,868 6,968  13,836  8,472  7,548  16,020  9,539  7,636  17,175  10,635  8,405  19,040  11,555  8,725  20,280
          Post graduate
                      1,310 841  2,151  1,713  775  2,488  1,660  722  2,382  1,843  1,317  3,160  1,741  1,143  2,884
          students
          Total       8,178 7,809  15,987  10,185  8,323  18,508  11,199  8,358  19,557  12,478  9,722  22,200  13,296  9,868  23,164


         Table below shows the number of Health Sciences’ Graduates in Public and Private Universities by Course and
         Sex for the period 2017/18 to 2021/22. The total number of graduates and post-graduates increased to 3,399 in
         2021/22. This was as a result of students whose graduation had been delayed from the previous academic year
         graduating within 2021/22 academic year. Male graduates accounted for 52.4 per cent of the total graduates in
         2021/22 academic year.


         54                                                                            Kenya Medical Directory